
Master ASP.NET Core Logging and Monitoring
Introduction to logging and monitoring in ASP.NET Core
Effective logging and monitoring are crucial for maintaining and troubleshooting applications, ensuring they run smoothly and efficiently. ASP.NET Core provides robust support for logging and monitoring, allowing developers to capture detailed information about the application's behavior and performance. In this blog, we'll explore the concepts, strategies, and practical implementations of logging and monitoring in ASP.NET Core.
Why Logging in Web Applications Matter?
Logging is a critical aspect of web application development and maintenance for several reasons:
1. Error Tracking and Debugging
Logs provide detailed insights into what went wrong when an error occurs. They can capture stack traces, error messages, and other relevant information, helping developers identify and fix issues efficiently.
2. Monitoring Application Performance
Logs can track the performance of various components of a web application, such as response times, database query durations, and resource usage. This data is essential for identifying bottlenecks and optimizing the application’s performance.
3. Security
Logging can help detect and analyze security breaches or suspicious activities. For example, by logging login attempts, access to sensitive data, or changes in user permissions, developers can spot and respond to potential security threats.
4. Audit and Compliance
Many industries have regulatory requirements that mandate detailed record-keeping of system activities. Logs can serve as an audit trail, providing evidence of compliance with these regulations and helping in investigations if compliance issues arise.
5. User Behavior Analysis
Logs can capture user actions and interactions within the application. Analyzing this data can provide valuable insights into user behavior, helping to improve user experience and drive business decisions.
6. System Health Monitoring
Continuous logging can monitor the health of the system by recording metrics such as uptime, error rates, and system resource usage. This helps in maintaining the stability and reliability of the application by allowing for proactive maintenance.
7. Troubleshooting Issues
Logs provide historical data that can be invaluable when troubleshooting intermittent issues that are hard to reproduce. They offer a timeline of events leading up to a problem, making it easier to diagnose and resolve.
8. Supporting Development and Testing
During development and testing phases, logging helps developers understand the flow and state of the application, making it easier to spot logical errors, incorrect assumptions, or unexpected behaviors.
9. Business Insights
Logs can contain data relevant to business processes and operations, such as transaction volumes, user demographics, and feature usage. This information can support strategic planning and operational decision-making.
10. Communication
Logs can facilitate communication between development, operations, and support teams by providing a shared source of truth about the application’s behavior and state. This helps in coordinating efforts to address issues or improve the application.
Best Practices for Logging
- Log Meaningful Information: Ensure that logs capture useful details without overwhelming the system with excessive data.
- Use Appropriate Log Levels: Differentiate between debug, info, warning, error, and critical logs to prioritize and manage them effectively.
- Ensure Log Security: Protect logs from unauthorized access and ensure sensitive information is not logged in plain text.
- Centralized Logging: Use centralized logging solutions to aggregate logs from multiple sources, making it easier to search, analyze, and manage them.
Logging Components:
Logging in web applications involves several vital components that collaborate to capture, store, and analyze log data. Understanding these components is essential for crafting an effective logging strategy.
1. Log Sources
These are where log data originates, encompassing:
- Application Logs: These capture events and errors from the application code.
- System Logs: Operating system events like process starts, stops, and failures.
- Server Logs: Activities of the web server, including requests and responses.
- Database Logs: Operations, queries, and transactions within the database.
- Security Logs: Events related to authentication attempts, access controls, and security issues.
2. Log Events
Log events constitute individual entries that record specific occurrences. Each event typically includes:
- Timestamp: Denoting when the event occurred.
- Log Level: Indicating the severity or importance of the event (e.g., DEBUG, INFO, WARN, ERROR, FATAL).
- Message: Providing a description of the event.
- Context Information: Offering additional data for context, such as user ID, request ID, or session ID.
3. Log Levels
These categorize the significance of log events:
- DEBUG: Furnishing detailed information for debugging purposes.
- INFO: Offering general operational insights.
- WARN: Highlighting potential issues warranting attention but not constituting errors.
- ERROR: Notifying about errors that occurred but allowing the application to continue running.
- FATAL: Signifying severe errors leading to application termination.
4. Log Format
Logs can adopt various formats, depending on requirements and toolsets:
- Plain Text: Straightforward and readable but lacking structure.
- JSON: Structured for easy parsing, suitable for automated processing.
- XML: Also structured but more verbose compared to JSON.
- Binary: Efficient but necessitating specific tools for interpretation.
5. Log Storage
Efficient storage of logs is crucial for retrieval and analysis:
- Local Files: Simple to implement but may become unwieldy with large volumes.
- Database: Offers structured storage and querying capabilities.
- Log Management Systems: Utilizing tools like Elasticsearch, Logstash, and Kibana (ELK stack) or Splunk for centralized and scalable log storage and analysis.
6. Log Aggregation
Centralizing logs from diverse sources:
- Agents: Software agents such as Logstash or Fluent collect and forward logs.
- Syslog: A standardized protocol for transmitting log messages over a network.
7. Log Rotation and Retention
Managing log data to prevent storage issues:
- Log Rotation: Automatically renaming, compressing, or deleting old log files.
- Retention Policies: Defining how long logs should be retained based on compliance and storage constraints.
8. Log Analysis and Visualization
Deriving insights and trends from log analysis:
- Search Tools: Enabling querying based on specific criteria.
- Dashboards: Utilizing visual tools like Grafana or Kibana for real-time views and insights.
- Alerts: Configuring notifications for specific log events or patterns indicating issues.
9. Log Security
Ensuring the protection of log data:
- Access Control: Limiting access to view or modify logs.
- Encryption: Securing log data in transit and at rest.
- Anonymization: Removing or masking sensitive information to comply with privacy regulations.
Ways to handle Sensitive Information in Logs in ASP.NET Core:
Handling sensitive information in logs within ASP.NET Core applications is crucial for maintaining security and privacy. Here are some best practices and strategies to ensure sensitive data is managed correctly in your logging:
- Use Built-in Logging Filters: ASP.NET Core’s logging framework allows you to control what gets logged both globally and per-logger. Configure logging levels in appsettings.json or through code to minimize the risk of logging sensitive information. For example, set the default log level to Information or Warning, and only use Debug or Trace levels during development or troubleshooting.
- Employ Structured Logging Wisely: Structured logging helps you log complex data types and objects. Ensure that the objects you log do not contain sensitive information. If they do, implement a serialization method that omits these properties or use custom serialization logic to mask or remove sensitive data.
- Be Careful with Custom Log Properties: When adding custom properties to your log entries, be cautious about the information included. Avoid logging sensitive information such as passwords, API keys, or personal identification information.
- Use Data Protection: If logging sensitive information is unavoidable, ensure the data is encrypted or masked. ASP.NET Core’s Data Protection API can be used to encrypt data before it is logged, though this adds complexity when reading the logs.
- Leverage Third-party Libraries and Tools: Consider using third-party logging libraries or tools that offer features for filtering, masking, or encrypting sensitive data. Libraries like Serilog, NLog, and log4net provide extensive configuration options for managing logged data.
- Conduct Regular Audits and Monitoring: Regularly audit your logging configuration and log files to ensure that sensitive information is not being logged. This helps in identifying and mitigating potential leaks.
- Ensure Compliance with Regulations: Be aware of compliance and regulatory requirements relevant to your application, such as GDPR, HIPAA, or PCI DSS. These regulations often have specific requirements for handling and logging sensitive information.
In ASP.NET Core, logging providers are components that store or display log data from an application. They are integrated into the ASP.NET Core logging framework, which allows for flexible and extensible logging across different destinations. Here are the main logging providers available in ASP.NET Core:
Logging Providers in ASP.NET Core Web API:
1. Console Logging Provider:
- Logs output to the console.
- Useful for development and debugging.
- Configured by default in many ASP.NET Core templates.
- Debug Logging Provider:
2. Logs output to the debugger.
- Useful for debugging applications in development environments.
- It can be added with Microsoft.Extensions.Logging.Debug.
- EventSource Logging Provider:
3. Writes log events to an EventSource.
- Useful for logging events that can be consumed by tools like Windows Event Viewer.
- Included with Microsoft.Extensions.Logging.EventSource.
- EventLog Logging Provider:
4. Writes log events to the Windows Event Log.
- Suitable for applications running on Windows.
- Can be added with Microsoft.Extensions.Logging.EventLog.
5. TraceSource Logging Provider:
- Uses System.Diagnostics.TraceSource for logging.
- Can be configured to log to different listeners, such as text files or other destinations.
- Available through Microsoft.Extensions.Logging.TraceSource.
6. Azure App Services Logging Provider:
- Specifically designed for logging in Azure App Services.
- Logs can be written to Azure Blob Storage, Azure Table Storage, or Application Insights.
- Configured through Microsoft.Extensions.Logging.AzureAppServices.
7. Application Insights Logging Provider:
- Integrates with Azure Application Insights.
- Provides detailed telemetry data and analytics.
- Requires Microsoft.Extensions.Logging.ApplicationInsights.
8. Third-party Logging Providers:
- Serilog: A popular structured logging library that allows logging to various outputs (e.g., files, databases, cloud services).
- Configured with the Serilog.Extensions.Logging package.
- NLog: Another popular logging library that supports extensive configuration and multiple targets.
- Configured with the NLog.Extensions.Logging package.
- Log4Net: A flexible logging library that supports many logging destinations.
- Configured with the Extensions.Logging.Log4Net.AspNetCore package.
Getting Started with Logging in ASP.NET Core
Setting Up Logging
ASP.NET Core comes with a built-in logging framework that supports various logging providers, including console, debug, and third-party services like Serilog, NLog, and Elasticsearch.
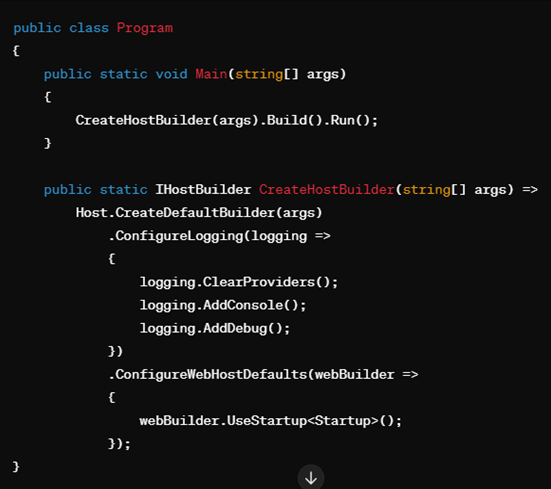
First, let's set up basic logging in an ASP.NET Core application. By default, logging is configured in the Program.cs and Startup.cs files.
Basic Logging
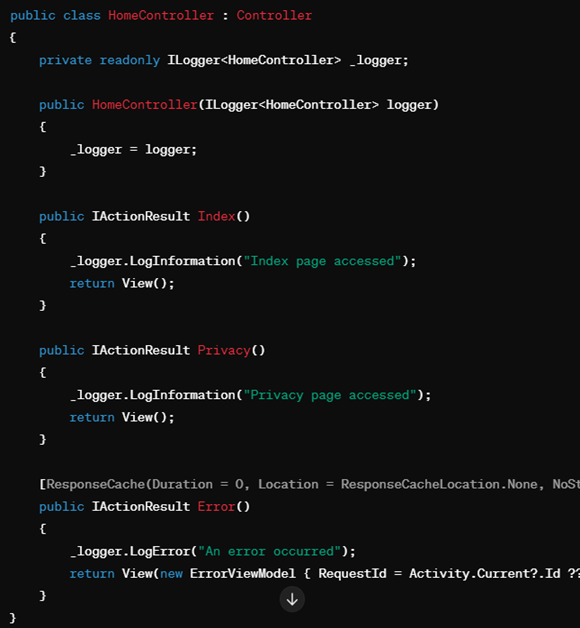
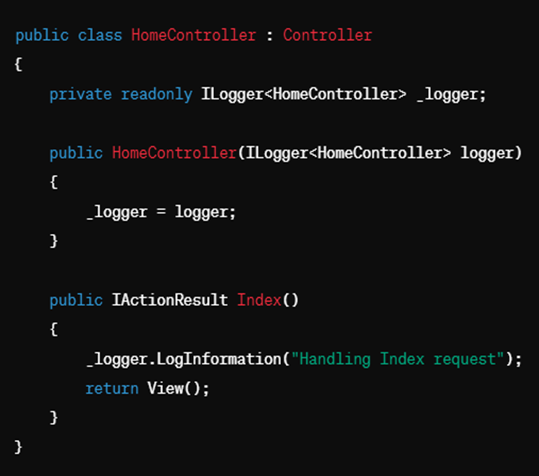
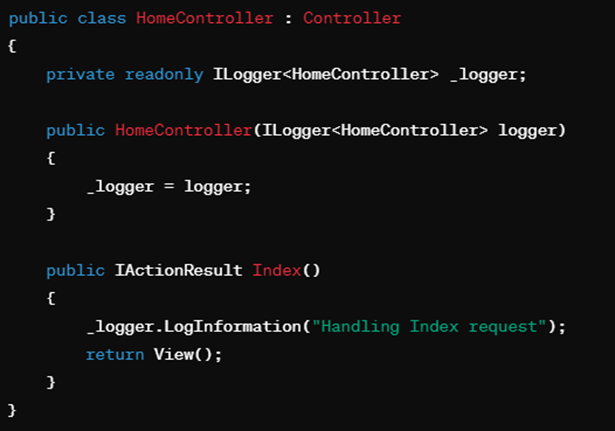
To log messages within your controllers or services, you inject an ILogger instance and use it to write logs:
HomeController.cs:
Log Levels
ASP.NET Core supports several log levels:
Trace: Verbose messages for development.
Debug: Detailed debugging information.
Information: General application flow information.
Warning: Highlight abnormal or unexpected events.
Error: Indicate failures in the current activity.
Critical: Fatal errors causing the application to crash.
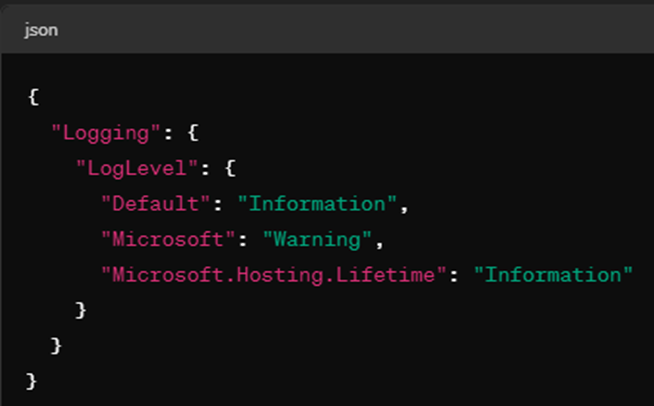
You can filter logs by setting the log level in the appsettings.json file:
Structured Logging with Serilog
Integrating third-party logging frameworks like Serilog or NLog with ASP.NET Core can greatly enhance your logging capabilities, offering more features and flexibility. Here’s how to do it:
Integrating Serilog with ASP.NET Core
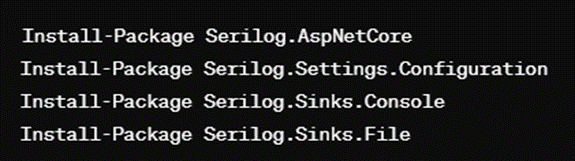
1. Install the Serilog Packages
Add the necessary NuGet packages to your project. You can use the NuGet Package Manager or run these commands in the Package Manager Console:
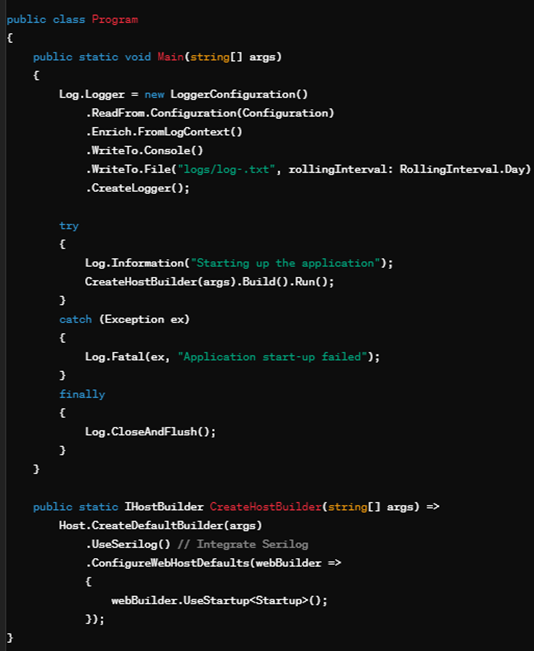
2. Configure Serilog in Program.cs
Modify the Program.cs file to set up Serilog as your logging provider:
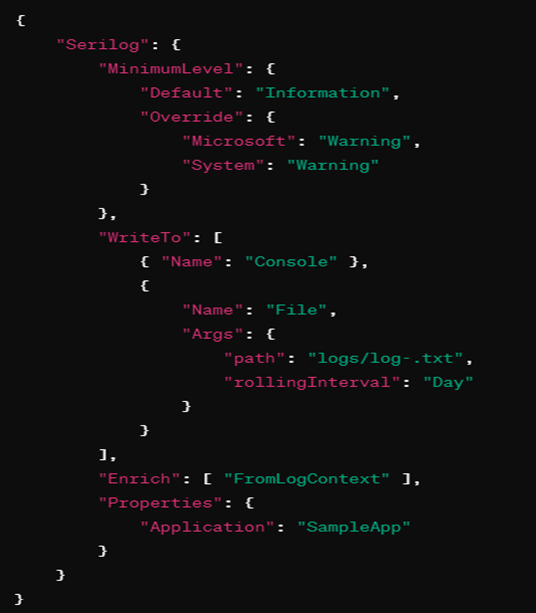
3. Configure Serilog in appsettings.json
Define the Serilog settings in your appsettings.json file:
4. Use Logging in the Application
Inject ILogger<T> into your controllers or services and use it for logging:
Integrating NLog with ASP.NET Core
1. Install the NLog Packages
Add the necessary NuGet packages:

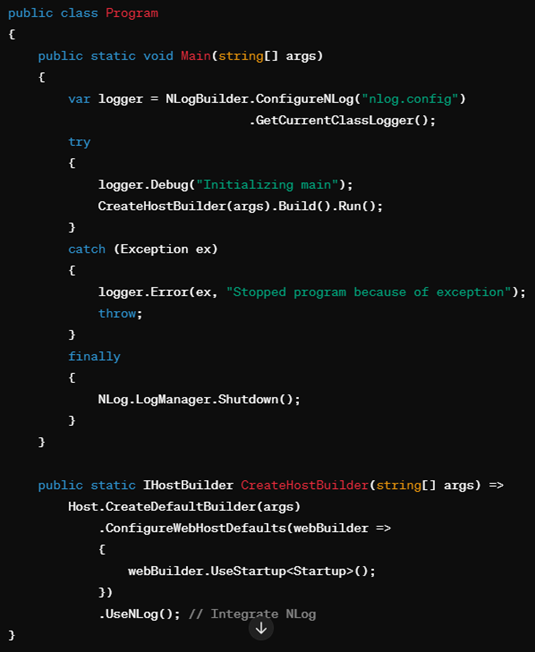
2. Configure NLog in Program.cs
Modify the Program.cs file to set up NLog as your logging provider:
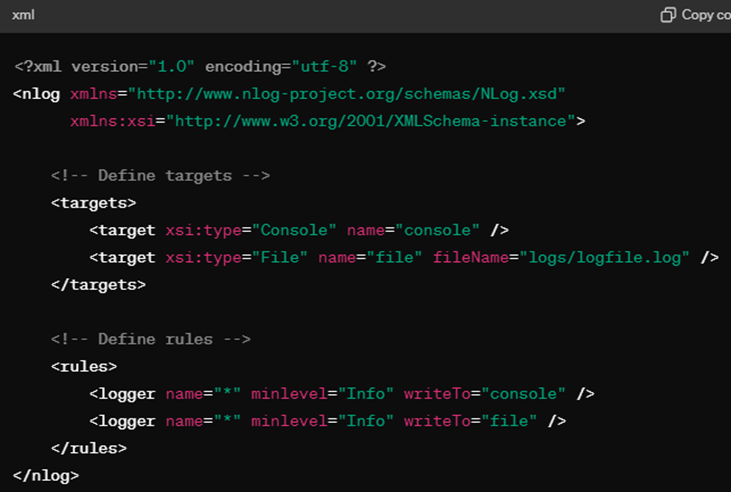
3. Configure NLog in nlog.config
Create a nlog.config file in your project's root with the following content:
4. Use Logging in the Application
Inject ILogger<T> into your controllers or services and use it for logging:
Monitoring and Log Analysis
In the dynamic world of software development, maintaining application health and performance is paramount. .NET Core, a versatile and powerful framework, offers robust logging capabilities to help developers monitor their applications effectively. This blog delves into the essential aspects of monitoring and log analysis in .NET Core, providing insights and practical tips to ensure your applications run smoothly and efficiently.
Why Monitoring and Log Analysis Matter
Monitoring and log analysis are critical for several reasons:
- Proactive Issue Detection: By continuously monitoring application logs, you can identify and resolve issues before they impact users.
- Performance Optimization: Logs provide valuable insights into application performance, helping you identify bottlenecks and optimize resource usage.
- Security: Analyzing logs can help detect and prevent security breaches by spotting unusual or unauthorized activities.
- Compliance: For many industries, maintaining detailed logs is a regulatory requirement, ensuring that applications comply with legal standards.
Centralized Logging
Centralized logging involves aggregating logs from various sources into a single location for easier analysis and monitoring. This approach is especially useful for microservices architectures and distributed systems. Some popular centralized logging solutions include:
- Elasticsearch, Logstash, Kibana (ELK Stack): This powerful stack allows you to aggregate, search, and visualize logs in real time. Logstash collects and parses logs, Elasticsearch indexes and stores them, and Kibana provides a web interface for querying and visualizing the data.
- Splunk: Splunk is a comprehensive platform for searching, monitoring, and analyzing machine-generated data. It offers powerful search capabilities and real-time dashboards.
- Azure Monitor: For applications hosted on Azure, Azure Monitor provides a fully integrated solution for collecting, analyzing, and acting on telemetry data. It includes features like Application Insights and Log Analytics.
Log Analysis
Once your logs are centralized, the next step is to analyze them to gain actionable insights. Here are some key techniques and tools:
- Search and Filter: Use search queries to filter logs based on specific criteria, such as time ranges, log levels, or keywords. This helps in pinpointing issues quickly.
- Dashboards and Visualizations: Tools like Kibana and Grafana allow you to create custom dashboards and visualizations, making it easier to monitor key metrics and trends over time.
- Alerts and Notifications: Set up alerts to notify you of critical events or anomalies. For example, you can configure alerts for error spikes, failed login attempts, or unusual traffic patterns.
- Machine Learning and Anomaly Detection: Some advanced logging platforms offer machine learning capabilities to detect anomalies and predict potential issues before they occur.
Best Practices for Monitoring and Log Analysis
- Consistent Log Format: Ensure that your logs follow a consistent format for easier parsing and analysis. Structured logging (e.g., JSON) is highly recommended.
- Sensitive Data Handling: Be mindful of logging sensitive information. Mask or omit sensitive data to comply with privacy regulations and security best practices.
- Log Rotation and Retention: Implement log rotation to manage log file sizes and set retention policies to retain logs for an appropriate period based on your requirements.
- Performance Considerations: Be aware of the performance impact of logging. Use asynchronous logging where possible and avoid logging excessive detail at high frequencies.
Blueflame Labs: Your Trusted Partner in ASP.NET Core Logging and Monitoring
Blueflame Labs empowers businesses to leverage the power of logging and monitoring ASP.NET Core applications. Our team of experts can help you:
- Design and implement a comprehensive logging strategy tailored to your specific needs.
- Integrate best-in-class logging tools and configure them for optimal performance.
- Gain valuable insights from your application logs to proactively identify and address potential issues.
- Ensure the secure storage and management of your log data.
By following the strategies outlined in this blog and partnering with Blueflame Labs, developers can leverage logging and monitoring to create robust, high-performing, and secure ASP.NET Core web applications.
Conclusion
Logging and monitoring are important for maintaining the performance of ASP.NET Core web applications. By getting detailed data on the application's behavior and performance, developers can quickly find and resolve issues, optimize performance, and maintain security standards.
A strong logging strategy includes various components such as log sources, events, levels, formats, and storage options and includes following best practices, such as logging relevant information and managing logs securely.
ASP.NET Core provides built-in support for logging and easily integrates with third-party tools like Serilog and NLog. These tools offer developers a detailed set of features to improve their application's stability, performance, and security. By implementing the strategies outlined in this blog, developers can use logging and monitoring to create strong and high-performing web applications.


 Strictly Necessary Cookies